
Step 4: Creating A Widget

Views
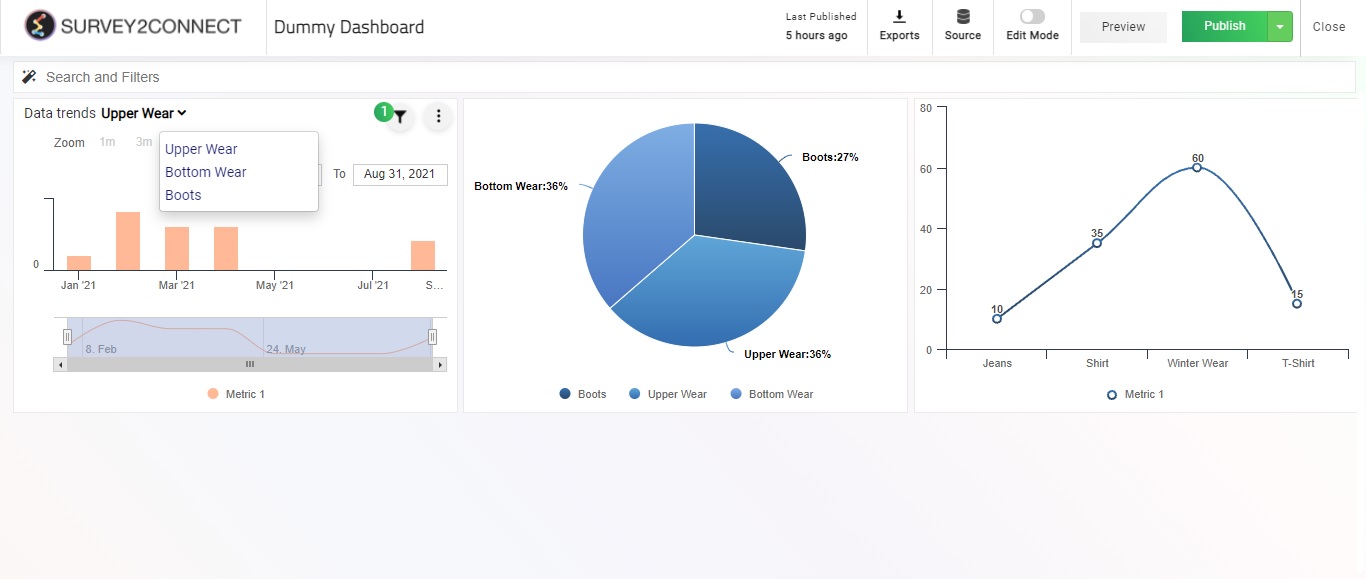
You can add a widget in your Dashboard from Survey2Connect’s collection of 13 widget types. The widgets let you present your survey data in a visual form using different chart types. The widget option with us ranges from Bar Graph, Pie Chart to Wordcloud and Data Trends. These widgets show the data based on the type of chart selected.
The steps to adding a widget to the dashboard are as follows:
1. اختر إدخال البيانات اليدوي New Widget
2. Select Widget Type

3. Add Widget heading and description that would be shown with the widget in the Dashboard.
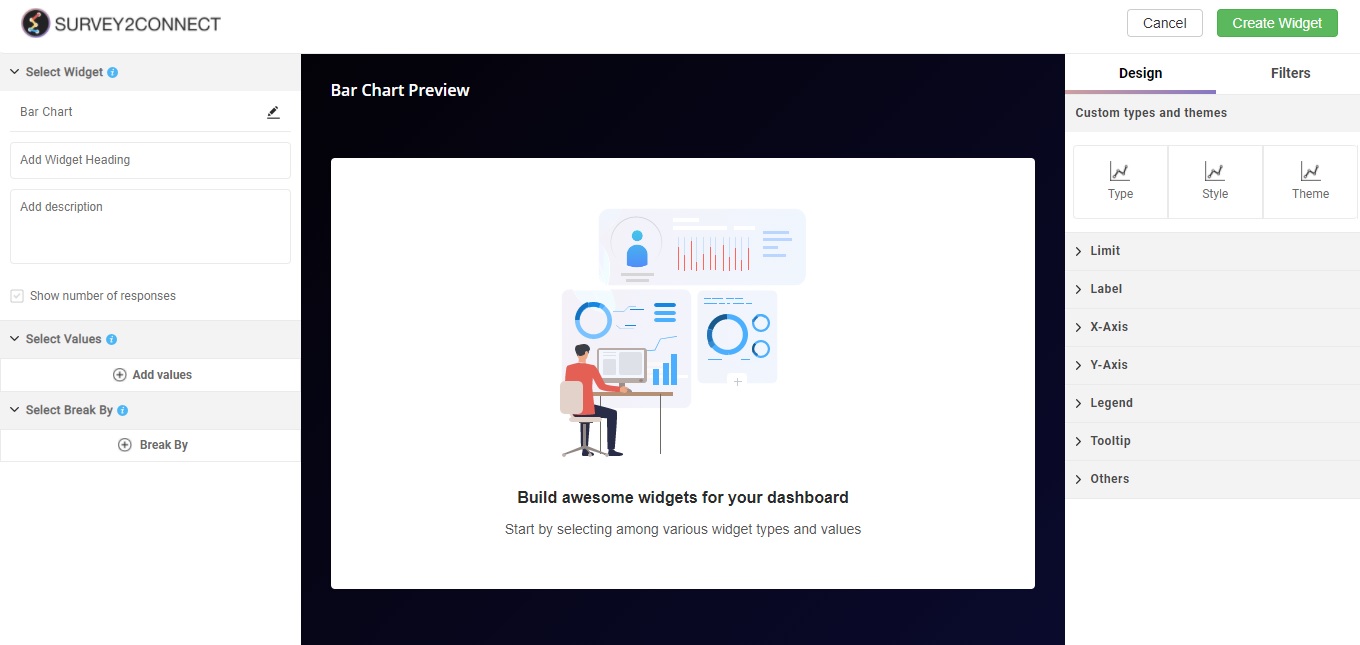
4. Select Values by clicking on Add Values. Values are the question or field on which the data would be added in the widget
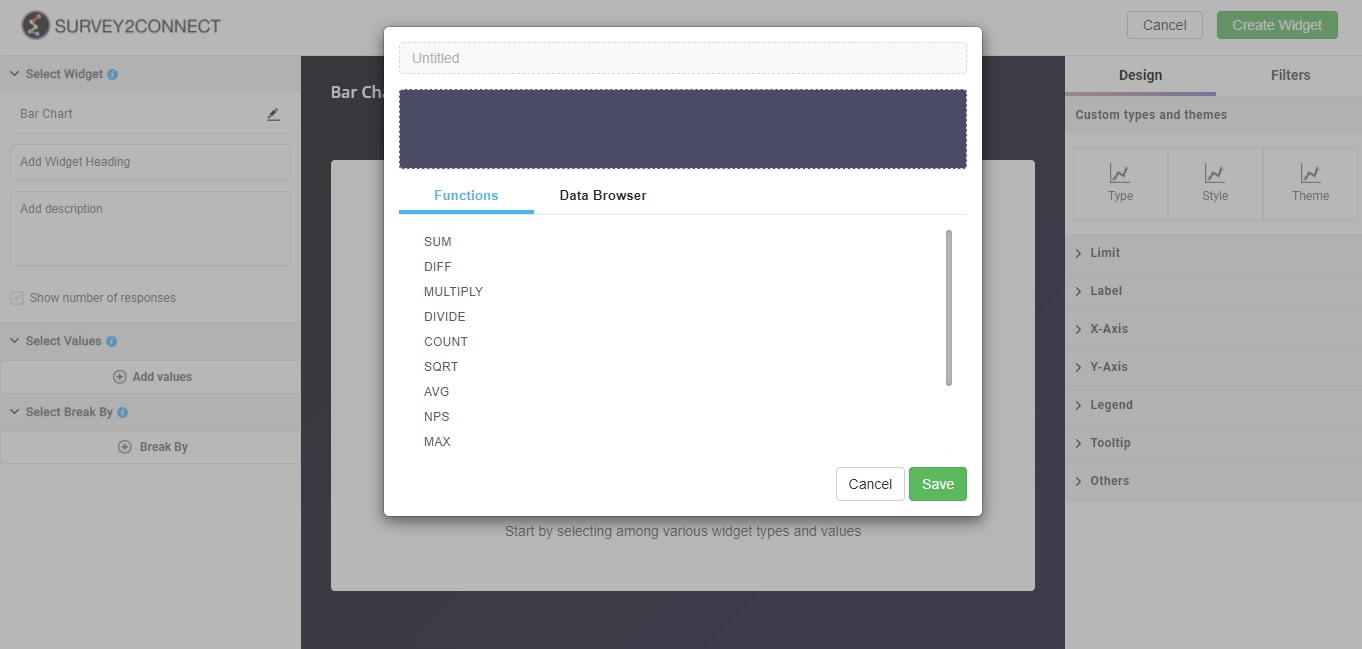
5. Select the function in the popup. The function contains the mathematical formula that would be applied to the data.
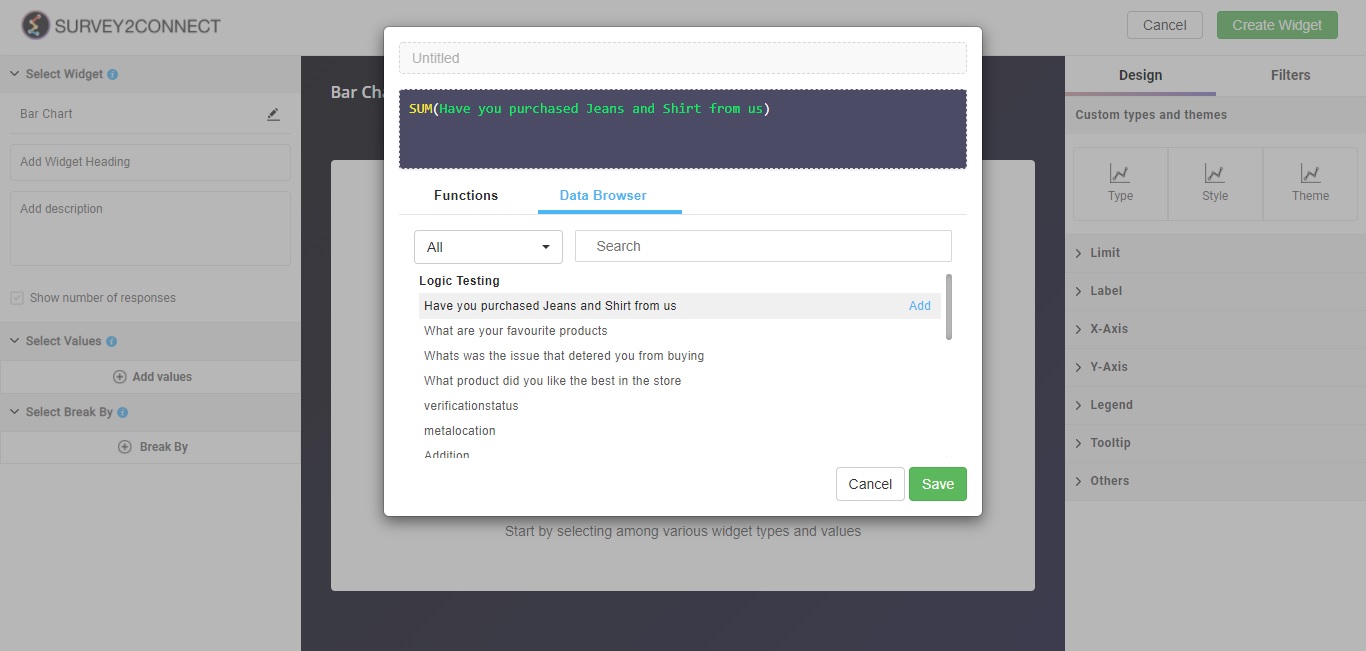
6. اختر حفظ Data Browser to select the question or variable you want to include in the function. Once you have selected the function and variable, click on Save
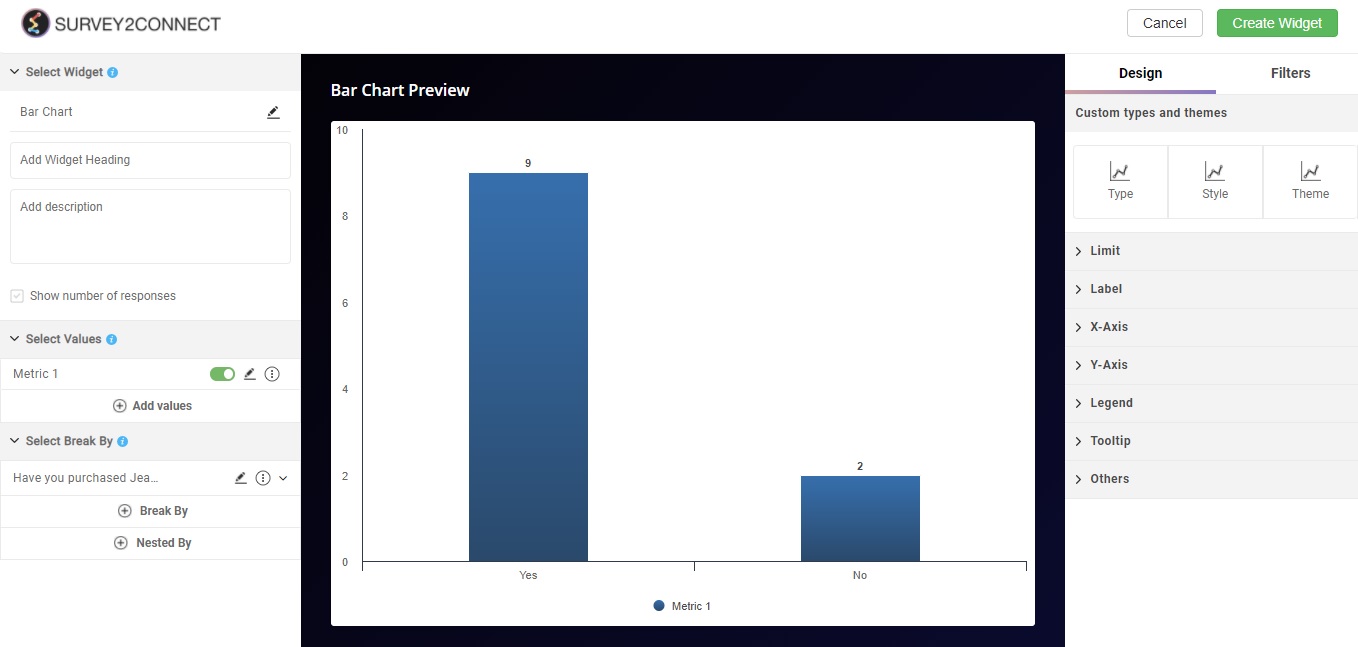
7. If you want to break your data on the basis of individual answer choices, click on Break By. Break By lets you distribute your data into smaller data sets based on your selection.
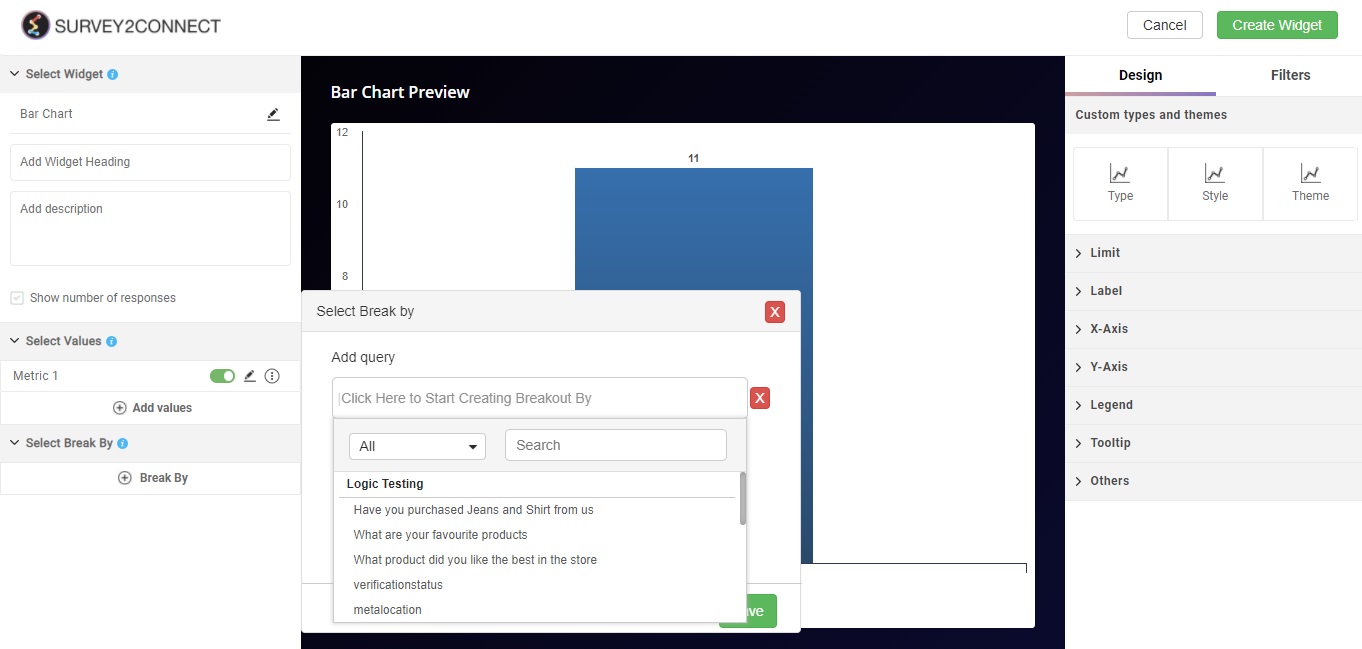
8. Select the question and the answer choice on the basis of which the data would break
9. Click Save
10. Manage Widget Design settings and filters
11. Click on Create Widget to add a widget to the dashboard
Types of Functions
Sum: This function would add the data within the bracket
Diff: This function would yield the difference between data sets in the bracket
Multiply: This function would multiply the data sets present within the bracket
Divide: This function would divide the data sets present within the bracket
Count: This function would yield the total count of data sets present within the bracket
SQRT: This function would yield the square root of data sets present within the bracket
AVG: This function would yield the average of the data sets present within the bracket
NPS: This function is used to calculate the Net promoter score
MAX: This function would yield the maximum figure of the data sets present within the bracket
MIN: This function would yield the minimum figure of the data sets present within the bracket
ملاحظة: You can apply multiple functions at a time by framing a proper formula. Your Data variable should always be within the brackets to ensure that formula is complete
ملاحظة: You can pipe a widget level filter to your Widget heading and once that is done, you would be able to see the option to toggle the widget data on the basis of the filter in the heading of the widget on the Dashboard home page.