Survey Summary Page shows you the details of the individual survey and summarizes the activities on that particular survey. It shows you the total count of responses alongside a response volume trend, summary of the survey, and active collector campaigns.
Summary
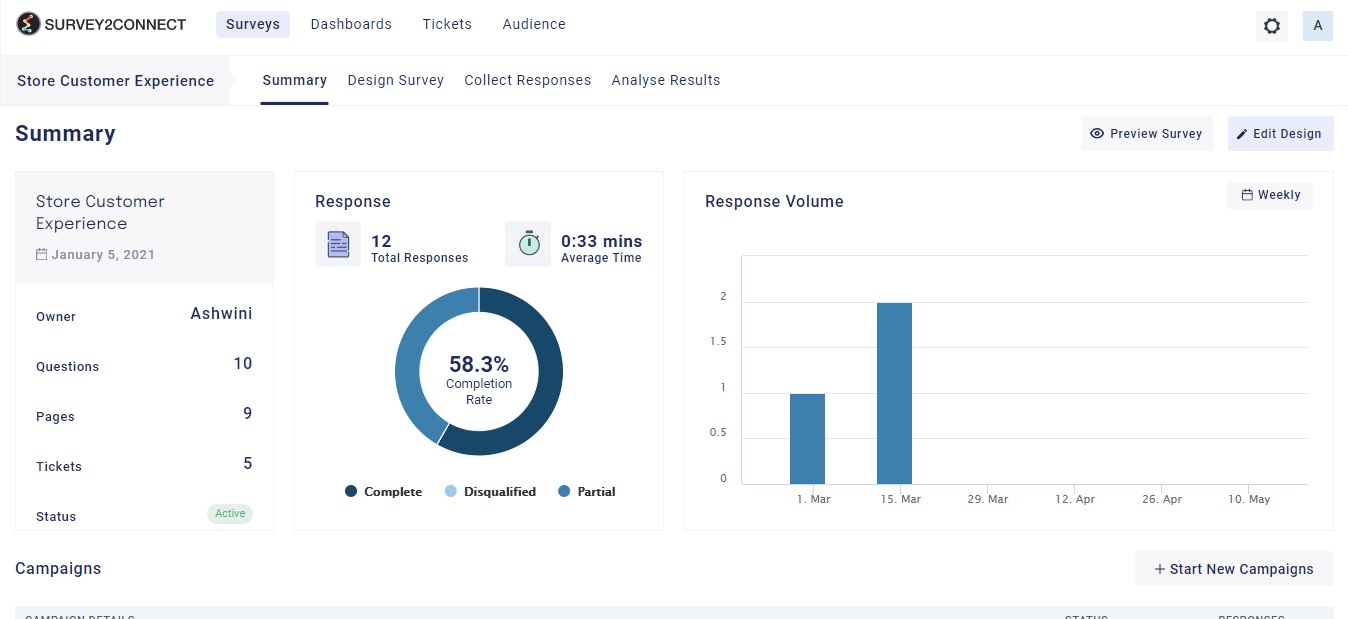
Under the summary section, you can see the survey of the individual survey in pointers. The available fields are:
Owner: This shows you the owner of the survey as in the person who created the survey.
Question: This shows you the total count of questions in your survey
Pages: This shows you the total count of pages in your survey
Ticket: This shows you the total count of tickets in your survey. Tickets are generated to solve an issue faced by customers based on survey responses. Click here to read more about tickets.
Status: This shows you the current status of your survey. There are two options — Active and Inactive.
Response
This shows you a pie chart of your responses. The data shows the count of total responses, the average time taken to fill the survey, and a pie chart based on completion of the survey.
Response Volume
This shows you the volume of your survey response over time. You can switch between 4 available options — Daily, Weekly, Monthly, and Yearly.
Preview Survey: This option lets you preview your survey and you can check how it would appear to your respondents.
Edit Design: This option leads you to the create survey module where you can further design your survey.
Distribute
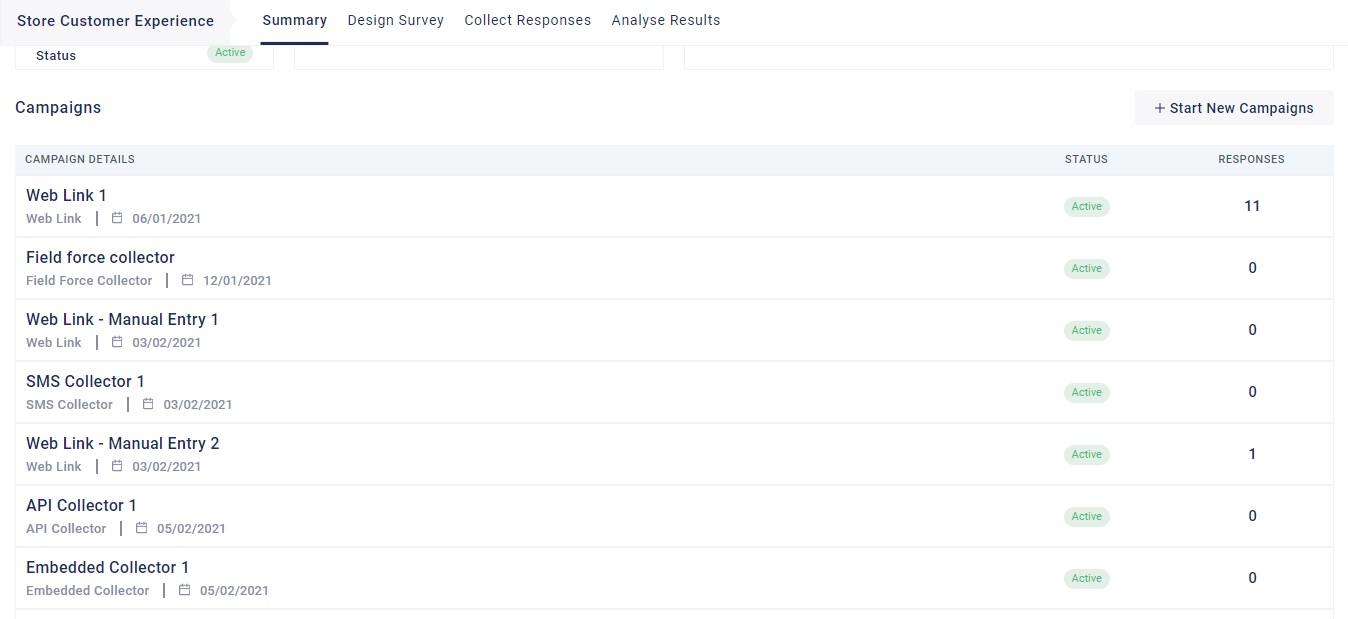
The Distribute page shows you all the active and inactive distribution channels created for a particular survey. A distribution channel is used to share your survey and collect responses from respondents across various platforms. With XEBO.ai, you get multiple distribution options that allow you to collect responses via Web Links, QR Codes, Email, SMS, WhatsApp, API, Embed, and more.
From this section, you can create and manage different distribution channels depending on how you want to reach your audience. Each channel represents a specific method of sending out your survey to respondents.
This page also provides an overview of each channel’s performance, including its status, health, and number of responses received. You can monitor which channels are active or inactive and track engagement levels for each distribution method.
Additionally, you can take actions such as viewing logs, editing configurations, or managing existing channels to ensure smooth and effective survey distribution.